Exercise 1
Do exercises 1, 4, 5 from Exam 2010.
Exercise 2 – Tree based methods
Consider a data set comprising 400 data points from class C1 and 400 data points from class C2. Suppose that a tree model A splits these into (300,100) assigned to the first leaf node (predicting C1 and (100,300) assigned to the second leaf node (predicting C2, where (n,m) denotes that n points come from class C1 and m points come from class C2. Similarly, suppose that a second tree model B splits them into (200,400) and (200,0), respectively. Evaluate the misclassification rates for the two trees and show that they are equal. Similarly, evaluate the pruning criterion for the cross-entropy case for the two trees.
Exercise 3 – Tree based methods
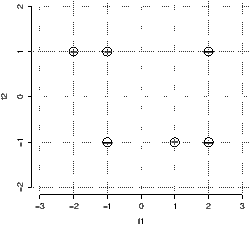
You are given the following data points: Negative: (-1, -1) (2, 1) (2, -1); Positive: (-2, 1) (-1, 1) (1,-1). The points are depicted in Figure 1.
Exercise 4 – Nearest Neighbor
Exercise 5 – Practical
Analyze by means of classification tree the data on spam email from the
UCI
repository. Use rpart from the rpart package and the
ctree from the party package.
Exercise 6 – PCA
Using the iris data readily available in R use principle
component analysis to identify two components and plot the data in these
components. Can you classify the data at this stage?
Exercise 7 – Probability and Independence
A joint probability table for the binary variables A, B, and C is given below.